WorldFin Astro 11 – Premium
Financial Astrology Software for Stock & Commodity Markets.Language: Hindi & English
M.R.P: ₹ 120,000/-
Foreign User USD : $ 1,335/-
System Requirements & Availability : WorldFin Astro 11 Premium Edition runs on Windows 10 Pro. and 11 Pro. A stable internet connection is required for activation and selected online features. Microsoft Excel (2007 or higher / Office 365) is required for data import and export tools.

WorldFin Astro 11 – Premium
WorldFin Astro 11 Premium Edition is a professional financial astrology software designed for traders, investors, and researchers who analyze stock markets, indices, commodities, and global instruments using planetary cycles, Panchang, KP, Naadi, and Sarvatobhadra Chakra (SBC). The platform combines classical Vedic astrology with real market price data to deliver structured, testable, and research-driven trading insights.
What Is WorldFin Astro 11?
WorldFin Astro 11 is a Windows-based financial astrology application that converts planetary movements into actionable market analysis. Instead of isolated charts or scattered calculations, the software provides a unified research environment where Panchang timing, planetary aspects, Nakshatra transitions, Lagna strength, KP coordinates, and market price behavior are analyzed together in real time.
This application is built for serious users who want to study why markets move, not just react to price.
Key Features of WorldFin Astro 11 Premium Edition
Complete Panchang-Based Market Timing SystemWorldFin Astro 11 includes advanced daily and monthly Panchang tools covering Tithi, Nakshatra, Yoga, Karana, Vaar, Rahu Kaal, Gulika Kaal, Yamaganda, Hora, Sub-Hora, Chaughadia, Muhurat Shastra windows, and Gowri Panchang. These tools help identify favorable, neutral, and risky time zones for intraday and positional trading.
Sarvatobhadra Chakra (SBC) & Classical Chakra Integration
The software features a fully interactive Sarvatobhadra Chakra with real-time transit and natal planet plotting. It also integrates Surya Kalan Chakra, Chandra Kalan Chakra, Kota Chakra, Koorma Chakra, Sanghatta Chakra, Sapta-Shalaka, and Panch-Shalaka systems. Traders can visually detect Vedha, direct hits, Shalaka effects, and energy flow across Nakshatra and Rashi zones.
KP & Naadi Financial Astrology Tools
WorldFin Astro 11 offers an advanced KP and Naadi tool suite, including intraday sentiment analysis, Navatara-based scoring, SBC Vedha scoring, Naadi coordinate buying-selling trend tools, and customized KP logic. Minute-by-minute KP coordinate tracking down to sub-sub levels provides extreme precision for high-volatility markets.

Market Research, Back-Testing & Pattern Discovery
The platform includes Market Today, Historical Data View, Common Point Search, Transit View, Astro Planet Movements Impact Search, Equal Declination Search, and a powerful Condition Maker & Result Finder. These tools allow users to define their own astrological rules and validate them against historical market data from 1999 onward.
Advanced Graphical & Visual Analysis Tools
WorldFin Astro 11 provides detailed graphical views that overlay planetary movements directly onto price charts. Users can study how sign changes, Nakshatra transitions, eclipses, retrogrades, declination extremes, and planetary aspects correspond with market rallies, corrections, consolidations, and volatility spikes. Monthly and historical views offer a clear visual bridge between astrology and real market behavior.
Excel Export & Data Integration
The built-in Excel export system allows users to export KP outputs, planetary strengths, SBC scores, timing intervals, and historical OHLC data into Microsoft Excel. This enables deep statistical research, cycle analysis, strategy modeling, and long-term validation of financial astrology methods.
WorldFin Astro 11 allows users to create and manage complete astrological profiles for stocks, indices, and commodities from India, USA, and Canada. Accurate listing date, time, and location data ensure precise horoscope calculations across all modules. Users can also import their own historical market data from Excel for personalized research.
Why Choose WorldFin Astro 11 Premium Edition?
WorldFin Astro 11 transforms traditional financial astrology into a structured, data-driven research platform. By combining Panchang, KP, Naadi, Sarvatobhadra Chakra, planetary cycles, and real market data, it helps users move from intuition-based analysis to repeatable, testable, and verifiable market studies.
• Professional stock market traders
• Financial astrologers and consultants
• Market researchers and analysts
• Commodity and index traders
• Institutions and serious individual investors
• Users developing astrology-based trading systems
This software is designed for disciplined research and informed decision-making, not blind speculation.

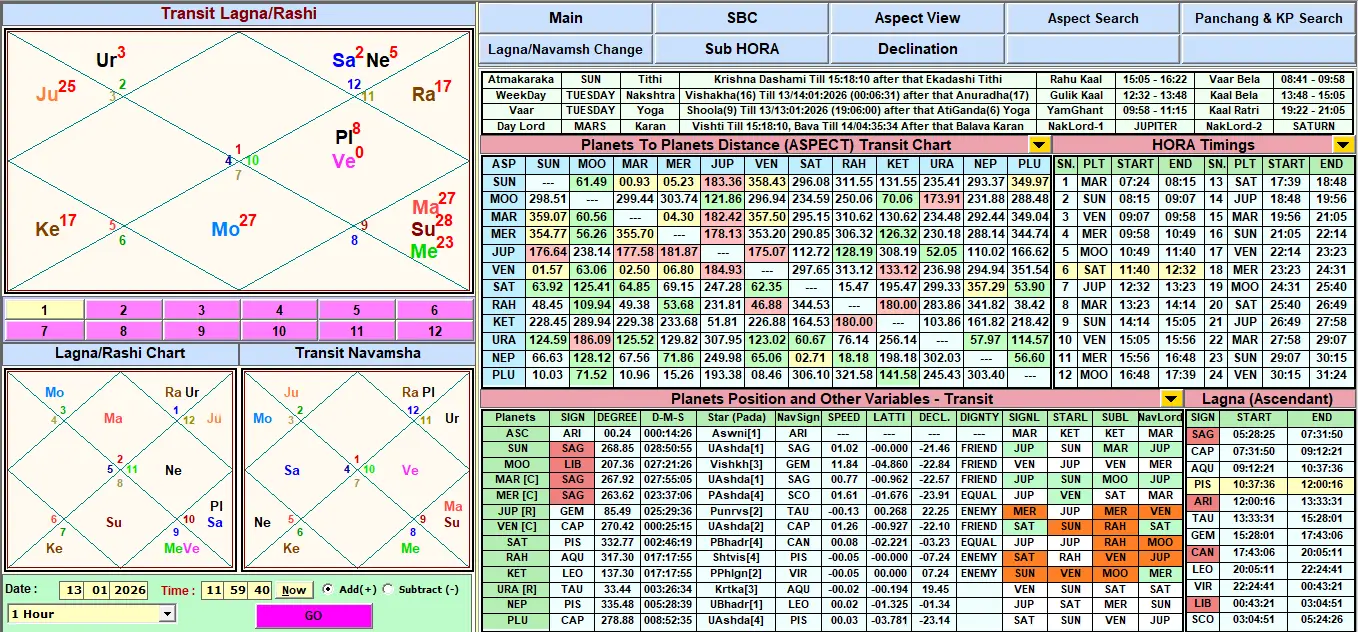
- Detailed Panchang
- Transit Lagna/Rashi, Birth Chart for Selected Native, Transit Navamsha Chart
- Planets To Planets Distance (ASPECT) Rashi Chart
- Planets To House Distance (ASPECT) Rashi Chart
- Planets To Planets Distance (ASPECT) Transit Chart
- Planets To House Distance (ASPECT) Transit Chart
- Planets (Rashi) To Planets (Transit) Distance (ASPECT)
- Planets To Planets Distance (180) Rashi Chart
- Planets To Planets Distance (180) Transit Chart
- Vaar/Tithi/Nakshatra Yoga
- Planets Position and Other Variables - Birth
- Planets Position and Other Variables - Transit
- Houses Position and Other Variables - Birth
- Houses Position and Other Variables - Transit
- Lagna Changes Strength and Kakshya Value
- Viewing Transit From Ashtak Varga
- HORA Timings
- Moon Sub Change Timings
- Chaughadiya Timings
- Planets Sign/Star/Pada Change
- Planets Navamsha Change
- Daily Lagna Changes Timings
- Detailed Sarvatobhadra Chakra (SBC)
- Latta Chakra Planets/Star
- Nava Tara Chakra @Birth
- Nava Tara Chakra @Transit
- Other Sensitive Nakshatra
- Arkhachatushtaya/Navashubha-Arkha
- Panchak and Dhrubank
- Detailed Vedhas in SBC
- Surya Kalanal Chakra
- Chandra Kalanal Chakra
- Koorma Chakra
- Kota Chakra
- Sanghatta Rashi Chakra
- Sanghatta Nakshatra Chakra
- Sapta Salaka Vedha Chakra
- Panch Salaka Vedha Chakra
- Strength of Planets in SBC (According to Vyapar Ratna)
0 (Poorna), 6 (Shashtyamsh), 9 (Chatvarishamsh), 12 (Trimshatamsh), 18 (Vimshamsh), 20 (Ashtdashamsh), 22.3 (Shodashamsh), 24 (PanchDashamsh), 30 (Dwadashamsh), 35 (Dashmamsh), 40 (Navamamsh), 45 (Ashtamamsh), 60 (Shashtamsh), 72 (Panchamsh), 90 (Chaturthamsh), 120 (Trityamsh), 135 (AshtamamshRahit), 144 (DashmamshRahit), 150 (DwadashamshRahit), 180 (Dwitiyamsh), 15 (Chaturvimshamsh)
Searching facility for Planet to planet aspect for given aspects on the given Time Frame
Lagna and Navamsha changes mark sharp shifts in market sentiment, indicating moments when the energy or direction of a stock can turn suddenly. Tracking these changes helps identify the exact minutes when planetary influence strengthens or weakens, improving accuracy in buy–sell decisions.
Hora and Sub-Hora changes indicate micro-shifts in planetary energy, creating short windows of strength or weakness in market behaviour. Tracking them helps traders pinpoint precise buy–sell moments with higher accuracy during intraday trading.
Equal Declination between two planets creates a powerful energetic resonance, similar to a conjunction, often triggering sharp market reactions. Traders monitor Equal Declination because it amplifies planetary influence and frequently marks high-impact intraday and positional trading moments.
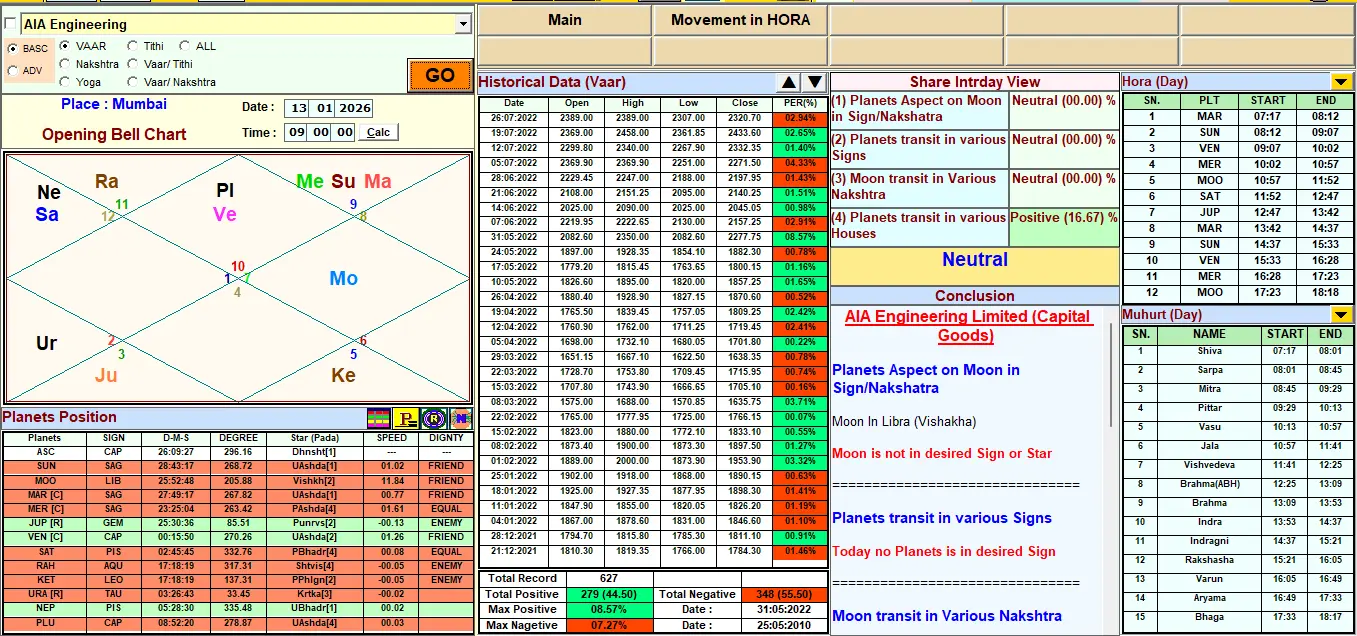
This tool is designed to analyze how planetary movements influence the performance of selected stocks in the market. We have included 100+ shares across 30 different sectors to provide a broad and reliable assessment. Each stock is evaluated using four key astrological factors that are known to impact short-term and intraday market behavior - 1. Planetary Aspects on the Moon (Sign & Nakshatra), 2. Planetary Transit in Various Signs, 3. Moon Transit Through Nakshatras, 4. Planetary Transit Through Houses, Separate section is available for showing Hora Movement Behaviour
1-Daily Planetary Positions 2- Daily Panchang 3- Planets sign Entry and Exit Dates 4- Planets Star Entry and Exit Dates
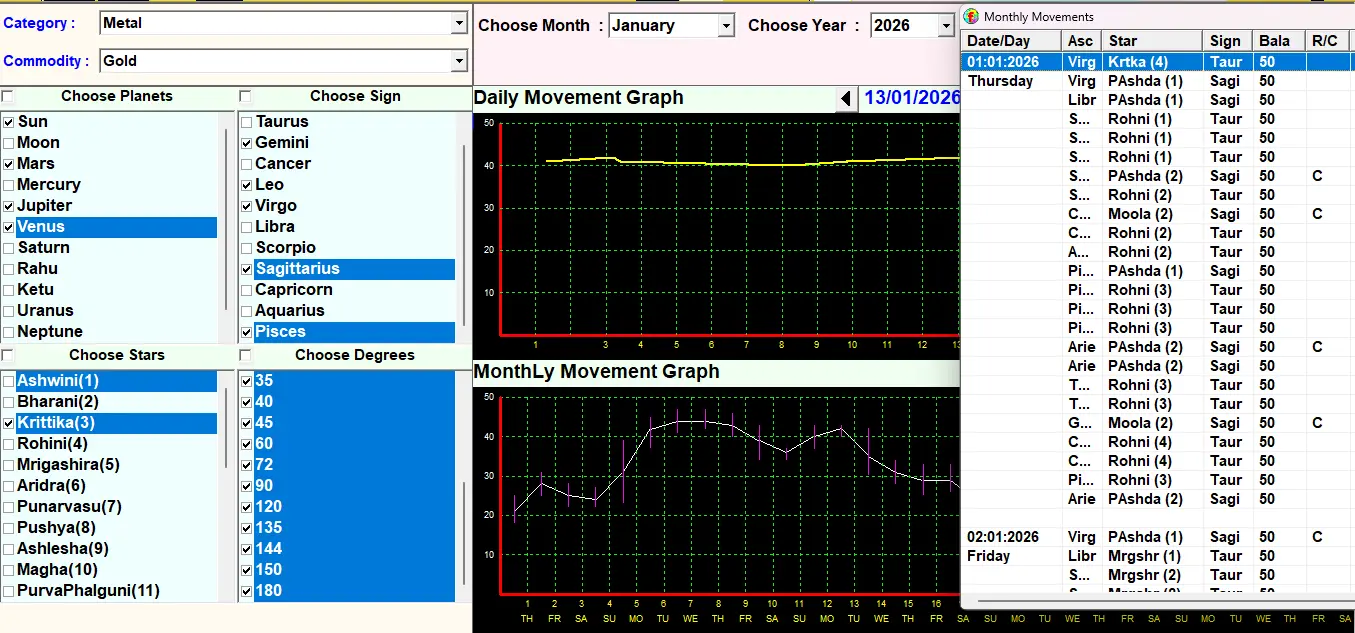
This Daily and Monthly Graphs tool features a multi-variable configuration panel for Planetary Trend Analysis. Users can define specific astrological parameters (Planets/Sign/Star/Aspect Degree) governing a chosen commodity. Key features include:
- Customizable Input Vectors:
Selection of governing Planets, Signs, and Nakshatras relevant to the asset class. - Harmonic Aspect Filtering:
Ability to filter specific degrees (Aspects) to isolate critical angular relationships. - Dual-Layer Forecasting:
The software computes these inputs to render two distinct datasets: a Daily Movement Graph for intraday volatility analysis and a Monthly Movement Graph for identifying broader trend cycles.
This tool allows the user to create powerful astrological conditions for commodities, grains, metals, and financial instruments, based on classical Financial Astrology principles found in renowned books such as Vyapar Ratna, Argha Martand, Brihat Arthik Jyotish, and many other market-based Jyotish texts. The tool then automatically applies these conditions to today’s Panchang and displays the expected astrological influence on the selected commodity.
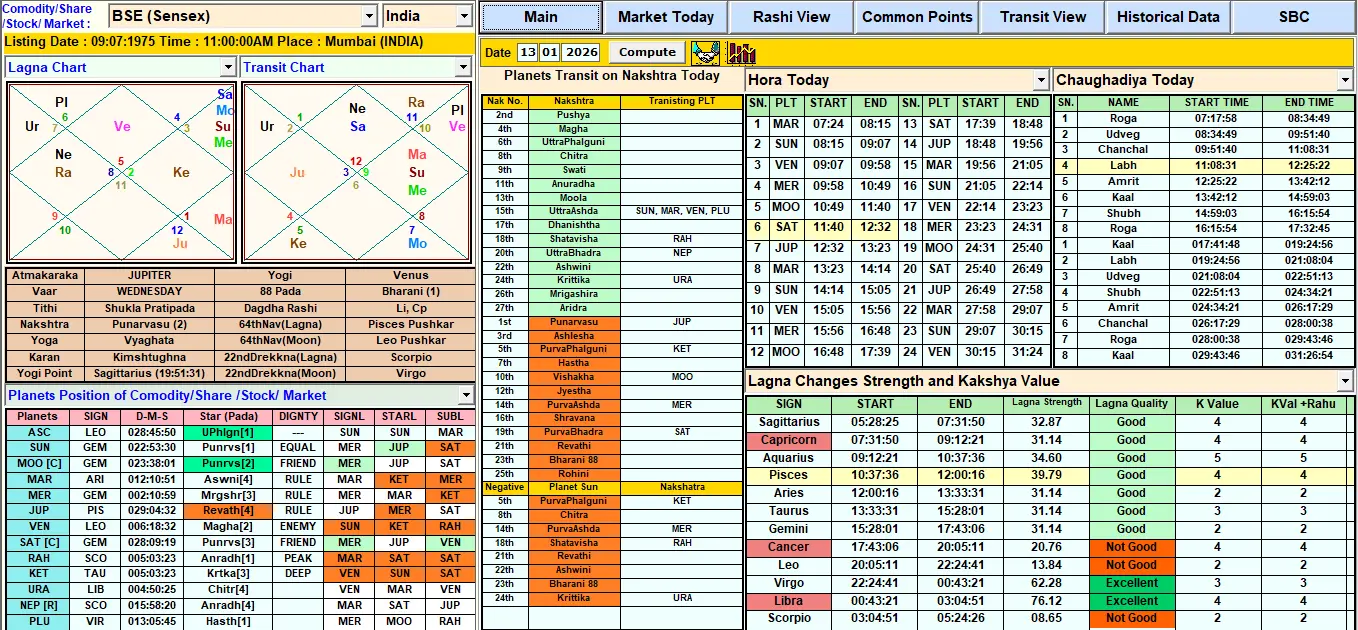
This tool provides an in-depth astrological analysis for more than 1700+ major Indian shares, 1100+ USA-listed shares, and 450+ Canadian market shares, along with major indices and commodities. Once a stock or market is selected, the tool instantly generates a full, multi-layered astrological profile, displaying every essential chart, divisional strength, and planetary influence required for high-precision Financial Astrology research.
Vaar (weekday), Tithi, Paksha, Nakshatra, Yoga, Karana, Yogi Planet, Avayogi Planet, Atmakaraka, 64th Navamsha, 22nd Drekkana, Planets Position of Commodity/Share /Stock/ Market, House Position of Commodity/Share /Stock/ Market, Lagna Changes Strength and Kakshya Value, Planets (Share) To Planets (Transit) Distance (ASPECT), Planets (Transit) To House (Share) Distance (ASPECT), Stocks, Indices & Commodities Vimshottari Dasha Upto Pran Dasha, Stocks, Indices & Commodities Shadabala and Bhava Bala
This tool highlights how today's planetary transits move through specific sensitive Nakshatras, which are known to influence market sentiment, trend formation, volatility, and sector-specific performance. The table visually categorizes each Nakshatra based on the nature of the planetary transit occurring within it.
This tool provides a comprehensive overview of the market’s current mood and potential movement based on the real-time transit of planets across different signs and Navamshas. By analyzing how each planet shifts through these astrological zones, the system helps identify trends, sentiment changes, volatility patterns, and sector-wise strength or weakness for the day. 1- Planetary transits through zodiac signs, 2 - Their micro-positions within Navamsha, 3 - Favorable and unfavorable combinations, 4 - Market-sensitive planetary triggers, 5 - Overall bullish, bearish, or mixed indications
This tool helps the user instantly identify common astrological factors among thousands of shares registered in India, USA, and Canada. By selecting specific combinations of planetary positions, signs, Nakshatras, Navamshas, KP parameters, Panchang details, or Vimshottari Dasha conditions, the user can quickly filter and find all stocks that share the same astrological signatures.
The Transit View tab gives the user a complete, data-rich picture of how today’s transiting planets are influencing the selected share or stock through their aspects, strengths, and inter-planetary interactions.
The Historical Data View tab provides access to the maximum available price history for the selected share, index, or market instrument. Each stock includes its full historical dataset—from the earliest available listing date up to the most recent trading day—allowing users to analyze long-term price trends with precision.
This tab provides a complete Sarvatobhadra Chakra (SBC)–based analysis by integrating the current transit planets with the natal planetary placements of the selected share. It also includes all supporting astrological chakras that enhance precision in financial astrology forecasting.
Along with SBC, multiple classical chakras are integrated for deeper interpretation: Surya Kalan Chakra, Chandra Kalan Chakra, Kota Chakra, Koorma Chakra, Sanghatta Rashi & Nakshatra Chakra, Sapta Shalaka Chakra, Panch Shalaka Chakra
This tool is designed to give traders a complete astrological snapshot of the day, helping them understand how planetary energies influence intraday market behaviour. It combines traditional Panchang elements with modern financial astrology parameters, making it one of the most powerful timing tools for stock market traders.
This tool use core Panchang elements—Tithi, Nakshatra, Yoga, Karana, and Vaar—along with their start and end timings. These elements decide the general mood of the day, indicating whether the day supports bullishness, volatility, consolidation, or caution in trading.
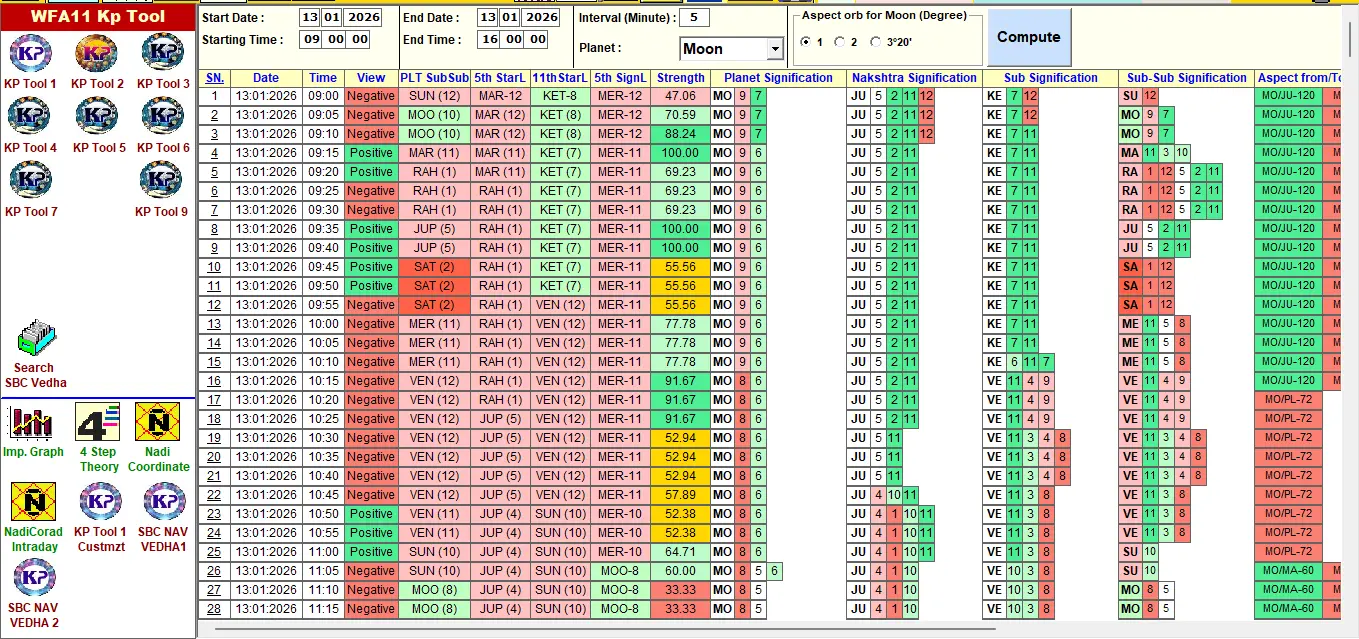
Your KP Daily Panchang Tool provides an advanced, time-specific astrological breakdown based on Krishnamurti Paddhati (KP Astrology). It is specially designed for intraday financial market forecasting, where precision timing is essential. This tool helps traders understand exact planetary influences every minute, allowing them to identify trend shifts, volatility pockets, reversal windows, and strong/weak time zones for trading.
The Planets Transit Search Tool allows users to quickly find when one or more planets will enter or leave any specific Sign, Nakshatra, or Nakshatra Pada within a selected time period. It is designed for astrologers and financial market analysts who track planetary movements to identify important future dates, trend-shift windows, and high-impact astrological events.
The Strength of Planets in Sarvatobhadra Chakra (SBC) tool calculates how powerful each planet is at a given time based on Vyapar Ratna principles. This strength directly influences the intensity of market trends, volatility, and sector-specific movements. By measuring Kshetra Bala, Navamsha Bala, Udaya Bala, Vakra Bala, and Uchha Bala, the tool shows which planets are dominating the market and which are weak.
The Lagna Strength Tool measures how powerful the Ascendant (Lagna) is at any given time, based on its Navamsha, Lagna lord placement, planetary dignity, and Vishwabal calculations. Since Lagna represents the market’s real-time mood, direction, and energy, a strong Lagna indicates stable trends, clear movement, and reliable price action—while a weak Lagna often brings confusion, sideways patterns, or sudden reversals.
Planetary Price–Time Cycle Tool, inspired by the legendary W.D. Gann system. This intelligent calculator transforms planetary degrees into actionable price levels and precise market timings, helping traders identify hidden reversal zones, trend accelerations, and high-probability intraday moments.
Gann Price–Angle Pivot Tool, a precision engine built on W.D. Gann’s legendary 360° price vibration method. This tool instantly converts price into harmonic angles to reveal powerful support, resistance, and reversal zones—long before they appear on the chart. Combined with classic pivot levels, it gives traders a complete map of intraday and positional turning points with unmatched clarity.
Dual Retracement Tool, combining the natural power of Fibonacci ratios with the geometric mastery of W.D. Gann’s 1/8th price division system. This advanced calculator instantly reveals high-probability support, resistance, and reversal zones—helping traders spot entry and exit points with exceptional accuracy.
Vimshottari Time Tool is designed to identify exact planetary Dasha periods that influence the behaviour of individual stocks. This tool automatically scans all shares or selected shares across India, USA, and Canada, and finds when a particular Dasha, Bhukti, Antara, Sukshma, or Pran period becomes active. Traders can instantly see which stocks will enter a powerful planetary period and which ones are entering weak or risky phases.
The Kota Chakra Search Tool helps traders identify the current planetary protection and vulnerability zones for each stock by analyzing its Kota Swami (Ruler) and Kota Pal (Protector) inside the Kota Chakra. Just as the Kota Chakra is used in Vedic astrology to judge safety, danger, and movement of a person, this tool applies the same principles to companies and stocks—revealing which planetary forces are supporting a stock and which forces are exposing it to risk.
The Panphara Degree Timing Tool identifies the most favourable time windows during the day when a native (trader or investor) receives strong astrological support for financial decisions. This tool analyses the placement of all planets in the native’s chart, checks their Panphara house activation, and maps each degree to a specific hourly energy cycle—giving the user a precise timing blueprint for profitable investing.
The Shodash Varga Position Search Tool allows traders and astrologers to find rare and powerful planetary combinations across all divisional charts (D1 to D16). Since high-level financial predictions depend on observing planetary strength beyond the main birth chart, this tool becomes essential for identifying major wealth periods, sector-specific trends, investment opportunities, and large financial breakthroughs.
The Navamsha Vedha in SBC Tool shows how minute-level planetary movements inside the Navamsha divisions create positive (supportive) or negative (obstructive) impacts, influencing intraday market sentiment with extreme precision. Since Sarvatobhadra Chakra (SBC) is the most sensitive timing tool in Vedic Financial Astrology, adding Navamsha makes the prediction highly accurate for minute-to-minute price reactions, breakouts, reversals, and volatility pockets.
KP Tool 1 is like a live mood meter for the market. It uses KP astrology to read any planet (Moon, Mercury, Jupiter, etc.) and checks which houses it is triggering every few minutes. The tool then shows simple Positive or Negative signals with a strength score, so you can quickly see when the market is likely to go up, fall, or stay confused. This helps you choose better times to buy, sell, or avoid trading, instead of guessing only from charts and indicators.
KP Tool 2 shows how strong or weak one planet is at every few minutes in the day. It checks three things from KP astrology – the house where the planet is sitting, the house of its Star Lord, and the house of its Sub Lord. These houses tell us whether the planet is giving profit houses (2, 6, 10, 11) or loss houses (8, 12) at that time.
KP Tool 3 shows you which shares are under “good stars” and which are under “bad stars” at any moment. It checks every company’s birth Nakshatra and then, using Navatara (Sampat, Vipat, Kshema, Naidhana, etc.), tells you whether today’s transiting planets are giving Wealth, Well-Being, Achievement or Accident, Obstacles, Death, Not Favourable results.
KP Tool 4 is your smart “astro-filter” for the whole market. It checks all shares through three levels of KP and Nakshatra rules and shows only those stocks that pass your choices, like Wealth, Well-Being, Friend, or warns you about Accident, Obstacles, and Death stars. In one click you get clean lists of strong, supportive shares and risky, weaker shares, so you can quickly build a watchlist for buying and a separate list to avoid—making your trading faster, safer, and more confident.
KP Tool 5 gives you a simple “Navatara scorecard” for any share. It checks where today’s planets are sitting in the share’s Navatara (Wealth, Well-Being, Accident, Death, etc.) and converts this into clear scores like +30, +15 or –15. All scores are added to show one Total Navatara Strength, so you can instantly see whether a day is strong and supportive or weak and risky for that stock.
KP Tool 6 is your personal “event predictor” for any stock or company. It checks how each planet supports or blocks a chosen event—like financial growth—using KP Astrology’s powerful cusp system. By showing clear supportive and negative scores for every planet, the tool instantly reveals whether the company is entering a strong, positive phase or a weak, risky one. With this simple yet accurate scoring system, you can time long-term investments better, avoid bad cycles, and understand a company’s true astrological strength with confidence.
KP Tool 7 gives you a clear, colour-coded map of a stock’s strength using the powerful Vedha system of the Sarvatobhadra Chakra. It shows which planets are supporting the stock and which ones are blocking it, and converts these effects into simple daily scores like +30 or –15. With both today’s Vedha strength and a full month-ahead view, you can instantly spot the best days for buying or holding and the risky days to avoid. This tool makes timing your trades easier, smarter, and far more confident by revealing the hidden planetary pressure behind every market move.
KP Tool 8 is one of the most powerful scanners in financial astrology, designed to instantly find stocks from India, USA, and Canada that match rare and highly sensitive astrological points like 64th Navamsha, 88 Pada, 22nd Drekkana, Yogi Point, and Yogi Planet. Instead of checking thousands of charts manually, this tool automatically filters and displays only those shares that are currently activated by important transiting planets. This makes it incredibly easy to identify stocks that are entering a high-impact zone, where sudden momentum, reversal, or breakout is most likely.
The 4 Step Theory Monthly Buying & Selling Trend Tool gives traders a clear and simple way to understand how the market will behave each day of the month. It uses powerful KP Astrology rules to study the four main lords of a day and turns this into easy percentages of buying strength and selling pressure. With this tool, users get a ready-made monthly roadmap showing which days are strong for bullish trades and which days may bring selling or weakness.
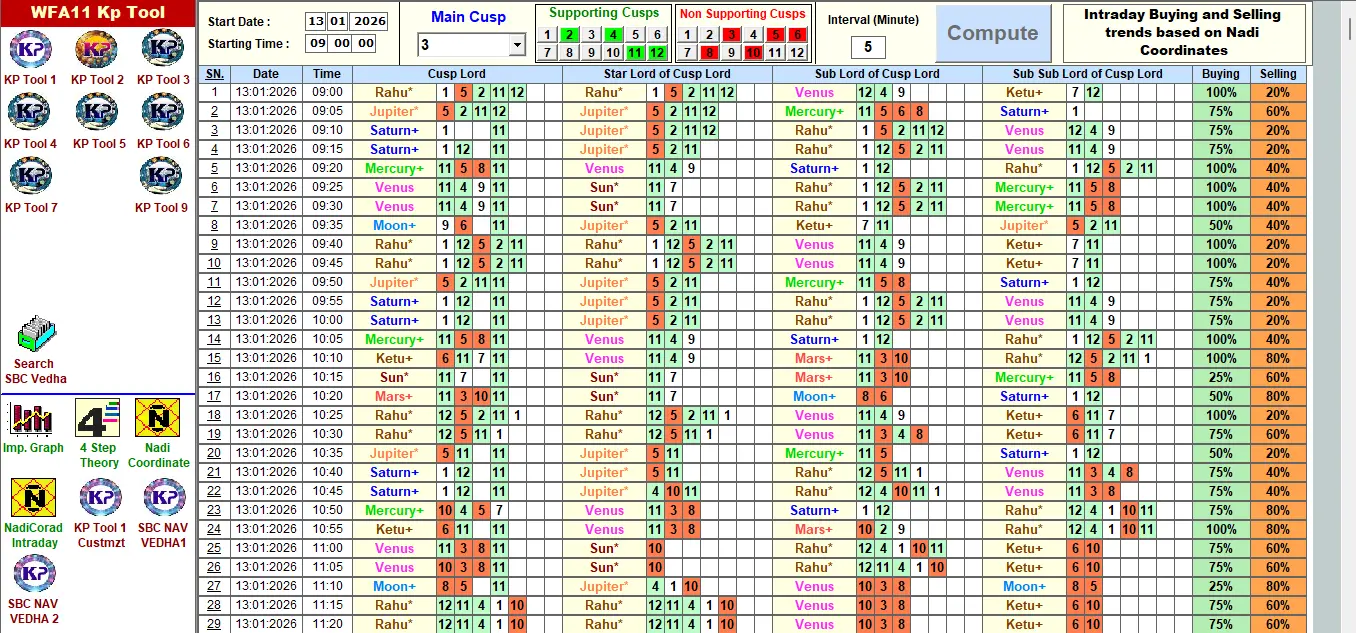
Naadi Coordinate Monthly Buying & Selling Trend Tool gives traders a clear and confident edge by turning complex KP-Naadi astrology into simple daily buy–sell signals. With just one click, the tool analyzes the Cusp Lord, Star Lord, Sub Lord, and Sub-Sub Lord to produce accurate Buying and Selling percentages for the entire month. You can also set your own Positive and Negative cusps, making the results even more personalized and powerful.
The Naadi Coordinate Intraday Trend Tool gives traders a real edge by turning KP–Naadi astrology into easy, real-time market signals. Every few minutes, the tool analyzes Cusp Lords, Star Lords, and Sub Lords to calculate clear buying and selling percentages, helping you see exactly when the market is likely to turn bullish or bearish.
KP Tool 1 is your instant market mood detector, turning fast planetary movements into clear buy-and-sell signals. With live Positive/Negative trends, strength scores, and fully customizable KP significators, this tool gives traders a smarter edge to time entries and exits with confidence. It removes guesswork and lets you see the market’s hidden energy in real time—simple, accurate, and powerful for every trading style.
The Panchang Tool 1 (Monthly Ephemeris) is one of the most powerful foundations of financial astrology because it gives a complete, day-by-day view of planetary positions along with all essential dignities. It displays each planet’s exact longitude, Nakshatra, retrograde motion, exaltation, debilitation, combustion, friendly/enemy sign, Pushkara degrees, Mrityu Bhaga, Vish Navamsha, Dagdha Rashi, and much more—everything a market astrologer needs in one screen. This allows the user to immediately judge market sentiment for any date by checking whether planets are strong, weak, afflicted, or exalted. The tool also gives Sun-rise times and Tithi for every day, which helps in identifying auspicious or sensitive trading windows. With flexible settings like True/Mean Rahu and the ability to switch to Tropical positions, this tool becomes a highly accurate ephemeris engine for global traders.
The Panchang Tool 2 (Daily Lagna & Navamsha Change) is extremely valuable in financial astrology because it shows the exact intraday timing of Lagna shifts and Navamsha transitions, which directly influence market mood, sector behavior, and short-term volatility. Every time block displays the Lagna sign along with the Navamsha it falls into, plus special conditions like Pushkar, Vargottam, Vish (inauspicious), and Shukra/Vaisha/Sarpa influences. These micro-timings help traders identify when the market is entering a supportive window (e.g., Cancer Navamsha with Pushkar) or a risky window (e.g., Vish Navamsha).
Panchang Tool 3 gives you a clear astro-edge by showing the daily strength, weakness, and mood of every planet in one simple view. With instant colour-coded benefic and malefic indicators and a compact monthly summary, you can easily spot the best days for trend trades, avoid high-risk planetary periods, and plan your market strategy with confidence. It works like a daily astro-weather forecast for traders—helping you time your moves smarter, faster, and with far more accuracy.
Panchang Tool 4 gives a clean, calendar-style view of the important daily astrological factors that affect market mood — such as Tithi, Nakshatra, Yoga, Karan, Sunrise/Sunset, and daily planetary changes. Each day is marked with easy color codes (green, yellow, red) to quickly show whether the day carries supportive, neutral, or challenging energies. This helps financial astrologers understand which days are better for buying, selling, taking risks, or staying cautious.
Panchang Tool 5 gives you a complete monthly astro-calendar designed for smarter trading decisions. It highlights every day’s Tithi, Nakshatra, Yoga, Karana, Moon sign, and special planetary events in one simple, color-coded view. With this tool, traders can instantly spot high-energy days, volatile periods, and favourable timings for entering or exiting the market. It replaces guesswork with clear astrological signals, helping you plan trades with better timing and greater confidence.
This powerful tool gives you the complete monthly declination and latitude of every planet—exactly where major trend reversals, volatility spikes, and unexpected market moves are born. With day-wise planetary extremes, out-of-bounds positions, and celestial crossings, you can spot reversal dates long before the charts show them. Perfect for traders who want deeper insight beyond price action, this tool brings Gann-style predictive accuracy into modern financial astrology.
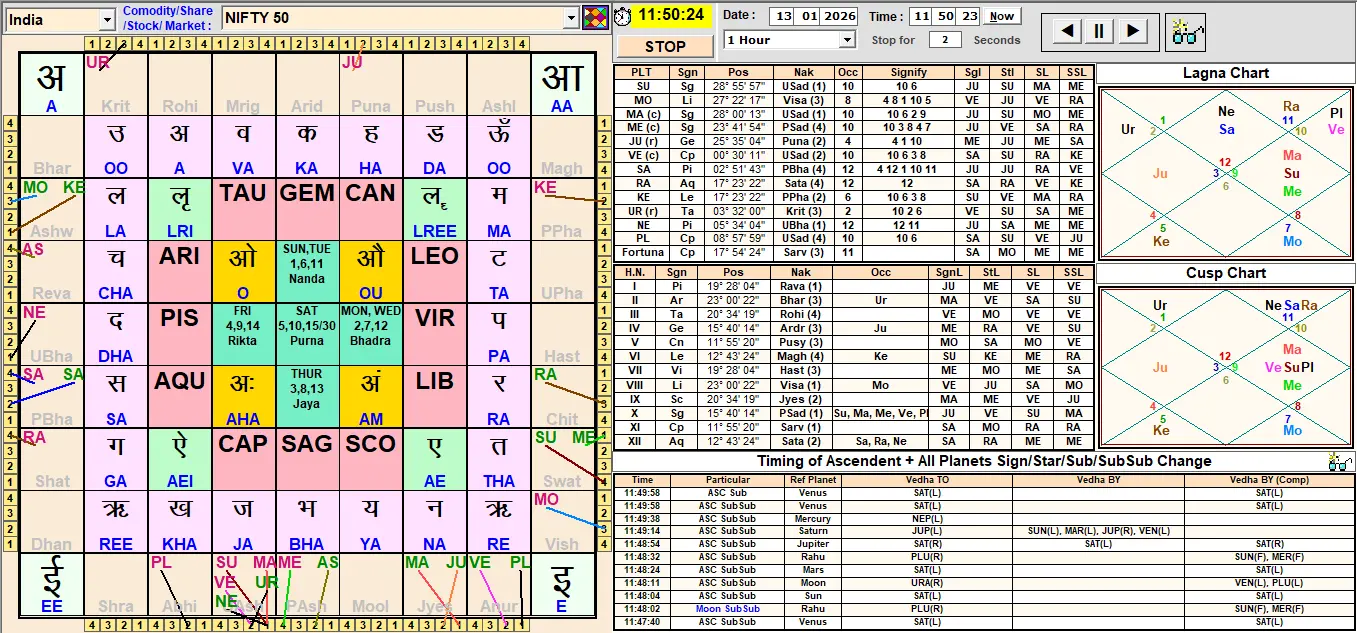
This tool is a game-changer for traders who operate in fast-moving markets like crypto, bullion, crude oil, forex, and high-volatility indices. It tracks minute-by-minute planetary Sign–Star–Sub–Sub changes and instantly shows how every small shift in KP significations impacts market energy. The tool detects every micro-transition of the Ascendant and planets and highlights positive or negative vedhas in real time, giving traders a razor-sharp timing advantage. With the integrated Sarvatobhadra Chakra view, users can visually see which Nakshatra, vowel, direction, or planet is being hit at each minute—allowing precise entry–exit timing, identifying breakout moments, and avoiding reversal traps. For markets where seconds matter, this tool becomes an indispensable timing instrument, offering the most detailed KP-level monitoring available in financial astrology.
The Visual Transit Tool is a powerful decision-making system in financial astrology because it provides a complete real-time picture of how planets are moving and interacting in the market. Its circular wheel displays planetary positions, nakshatras, signs, degrees, and angles like a live cosmic dashboard, helping traders instantly spot market-moving events such as conjunctions, oppositions, squares, trines, and sensitive degree hits. The right-side panel shows color-coded planet-to-planet aspect distances, revealing strong positive or negative influences that often trigger volatility, reversals, rallies, or sudden drops. The bottom panel further adds precision by showing each planet’s degree, star, sub, sub-lord, speed, latitude, declination, and dignity — essential factors for predicting money flow, trend strength, and perfect timing for trades.
The Astro Planet Movements Impact Search Tool is one of the most powerful research engines in financial astrology because it allows traders to test any astrological condition directly against real historical market data. Using the Vedic Astro Search panel, you can filter days based on planets in specific Signs, Nakshatras, Padas, Navamshas, or check whether a planet was Retrograde, Combust, or forming a conjunction in Rashi, Nakshatra, or Navamsha. You can even include Panchanga elements like Tithi, Vaar, Nakshatra, Yoga, Karana, Panchak, and Ghabad Muhurt. Once you set a condition, the tool scans the entire historical record and instantly tells you how many times the market closed positive or negative under that exact planetary setup. This makes it extremely valuable for discovering winning astrological patterns, back-testing theories, building high-accuracy trading rules, and understanding how specific planetary combinations influence Shares, stocks, commodities, or global indices.
The KP Astro Search Tool brings the precision of KP astrology directly into market research, allowing traders to test how specific Day Lords, Sign Lords, Star Lords, Sub Lords, and Sub-Sub Lords have historically influenced market movement. By selecting any combination of KP significators, the tool instantly scans the entire historical database and reveals whether the market closed positive or negative on days matching those exact planetary conditions. This gives traders a scientific way to validate KP rules, discover high-probability setups, and build powerful trading strategies based purely on proven market behavior. For researchers, it is an unmatched tool to study planetary influence with real data — transforming intuition into measurable, dependable results.
The Miscellaneous Search Tool is a powerful research feature that helps traders understand how the stock market reacts when planets occupy certain elements (Fire, Earth, Air, Water), modalities (Movable, Fixed, Dual) or castes (Brahmin, Kshatriya, Vaishya, Shudra). Instead of guessing, the tool scans entire historical market data and shows whether such planetary combinations created positive or negative days in the past. The color-coded results make it easy to see patterns instantly. With this tool, any trader or researcher can discover which planetary distributions bring strength or weakness to the market, how many planets in Fire or Fixed signs impact trend direction, and which cosmic setups produce strong rallies or sudden drops. It is a unique and highly valuable tool for building reliable trading strategies using real astrological impact, backed by years of historical evidence.
The GapUp–GapDown Search Tool is extremely valuable for traders because it reveals how often a stock or index opens with a strong jump (GapUp), a fall (GapDown), or a neutral start across its entire trading history. By combining this data with panchang factors such as nakshatra, tithi, yoga, karan, and weekday, the tool helps users clearly see which cosmic conditions most often create bullish openings and which ones lead to bearish starts.
The Panchang Based Rating Tool helps traders look into the future performance of any stock by evaluating daily Vaar (weekday), Tithi, Nakshatra, Yoga, and Karan — the five pillars of the Panchang. Each of these elements has a predefined strength value, and the tool combines them to give a daily rating score. This makes it easy to identify which upcoming dates are naturally supportive, neutral, or risky for market movement. By scanning future days with colored highlights and point values, traders can quickly select high-probability dates for buying or selling and avoid low-rated days that may bring weakness or volatility.
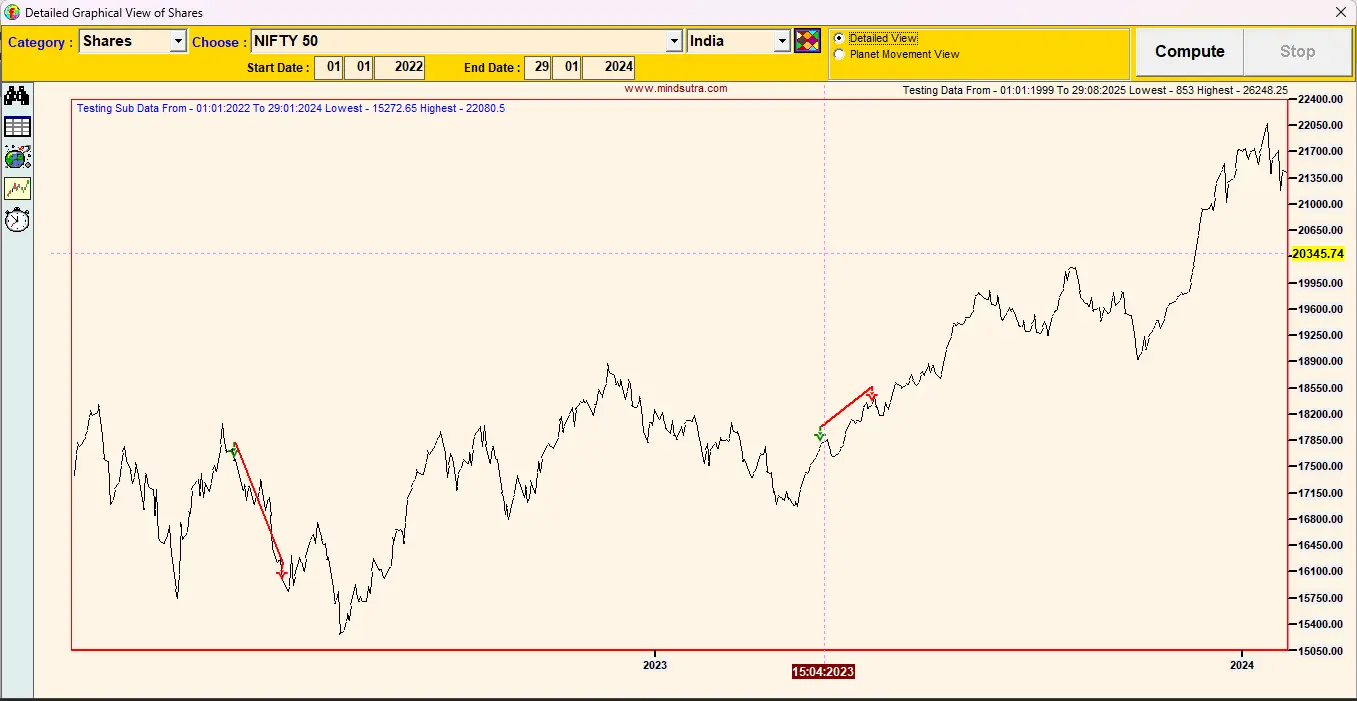
The Shares Graphical View tool is a powerful feature that lets traders instantly visualize the complete price history of any stock from India, USA, or Canada. By selecting a custom time range, users can study long-term market cycles, major trend reversals, sudden crashes, and extended rallies — all of which are essential for connecting price movements with astrological events. This tool helps financial astrologers identify how planets influenced the market during key periods such as tops, bottoms, and breakout phases. The clean, zoom-free line chart makes it easy to compare past planetary transits with historical price swings, improving prediction accuracy for future market behavior.
This tool is extremely important for financial astrologers because it allows users to visually study how the market behaved whenever a specific planetary condition occurred. By selecting any planet in a particular sign, nakshatra, or aspect with another planet, the software automatically highlights all matching periods on the historical price chart. This gives traders a crystal-clear understanding of how powerful events — such as Jupiter entering Aries, Saturn aspecting the Moon, or Mars forming a square — have influenced major rallies, corrections, or sideways movements. Instead of guessing, users can directly see on the graph (marked in green/red segments) what the market actually did during those astrological combinations. This turns planetary research into a practical forecasting tool, helping traders identify repeating patterns and high-probability setups for future market moves.
The Graphical Planets Ephemeris tool visually overlays the movement of any selected planet—such as the Sun, Mercury, Jupiter, or Saturn—directly on the price chart, allowing traders to see how market trends align with planetary cycles.